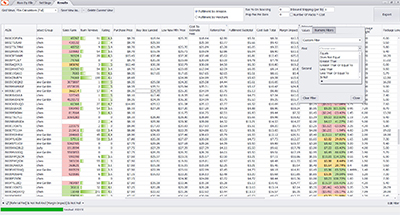
Historical Trend Periods Now Adjustable in the Grid
What’s New
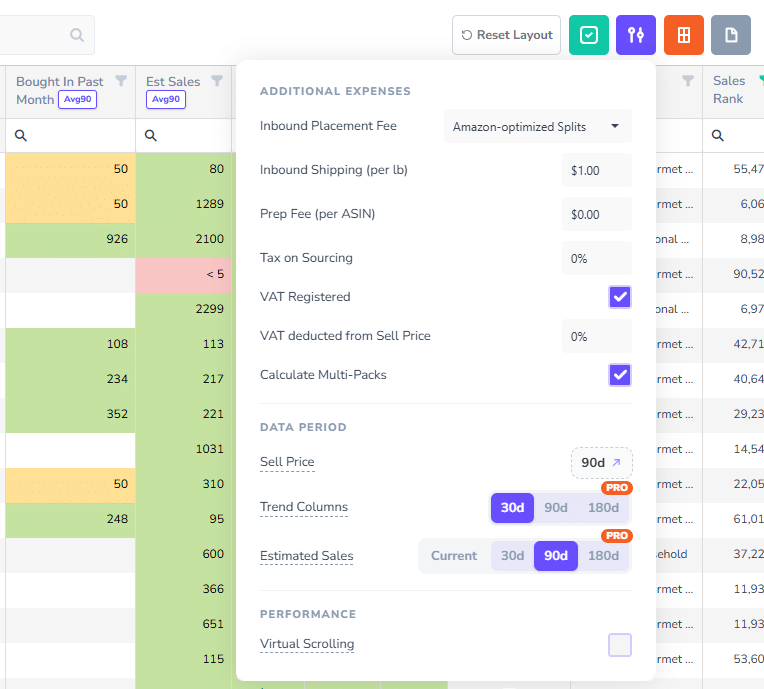
Historical Trend settings have been moved from Processing Options directly into the grid.
You can now switch between 30, 90, and 180-day historical periods instantly, without reprocessing your scan. We’ve also consolidated several historical trend columns, reducing grid clutter while making more historical data accessible on demand.
- Introduction (00:00)
- Example Using Est Sales Trends (00:20)
- Example Using Trend Columns (01:42)
- More Data, Less Clutter (02:35)
- Conclusion (03:39)
Key Benefits
No reprocessing required
Switch between 30, 90, and 180-day historical periods instantly without running your scan again.
10 fewer columns
Historical trend data is now displayed more efficiently, creating a cleaner and easier-to-navigate grid.
Access more historical data
Previously, metrics such as Estimated Sales and Bought in Past Month could only display a single historical period selected during processing. To view a different period, you had to change your settings and reprocess the scan. You can now switch between historical periods instantly within the grid.
Faster analysis
Compare short-term and long-term trends without interrupting your workflow.
How It Works
- Run your scan as usual
- Toggle historical trend directly in the Grid Settings
- Choose Current, 30, 90, or 180-day historical averages
- The grid updates instantly with the selected timeframe
Important Note
Sell Price historical periods remain managed through Processing Options and still require reprocessing.
This is intentional because Amazon fees, profit calculations, ROI, and related metrics are all derived from the selected Sell Price period. Reprocessing ensures these calculations remain accurate throughout the application.
This update gives you more historical insight, less grid clutter, and a faster workflow for analyzing product trends.


Related Articles
-
Override Incorrect Multi-Pack Quantities in Bulk
 News & Updates
Web
4 months ago
News & Updates
Web
4 months ago
-
Show Premium Data Selectively For Faster Scans
News & Updates
Web
5 months ago
-
Metric/Imperial Units, Digital Services Fee & Storage Fee Transparency
News & Updates
Web
5 months ago
-
Grid Autosave
News & Updates
Web
6 months ago
-
Bulk Check Seller Restrictions (Amazon Ungating)
News & Updates
Web
8 months ago
-
Update to Premium Data Usage
News & Updates
Web
10 months ago